Feature
Token spend by source. Cache-aware cost. Timezone-correct charts. The dashboard is only useful if the numbers are trustworthy — so we spent an entire release making it so.
Modern model usage isn't just prompt tokens and completion tokens. Caching, plugin calls, vision APIs and background system activity all move the bill in different directions. If the dashboard treats all of that as "tokens used", the cost picture is incomplete.
Pinchy tracks each source separately. So when a company asks "why did this agent cost so much yesterday?" the dashboard has an answer beyond "there were tokens".
Tokens spent in user conversations. This is what most people intuitively mean by "AI cost", but it's only a slice.
Background activity: memory updates, summarisation, tool preflights, automated housekeeping. Usually smaller, but easy to ignore if nobody's looking.
Work done by plugins the agent invokes — including vision-API reads inside pinchy-files for PDFs and images, which gets expensive without being obvious.
Tracked separately and included in cost estimation. Caching changes the economics; the dashboard reflects that instead of pretending it doesn't exist.
A dashboard that looks nice but subtly misleads is worse than no dashboard at all. A few choices that sound like presentation logic but aren't:
Daily aggregations are grouped by day in your timezone. If "Tuesday" silently meant UTC while you meant Vienna, the chart wouldn't be observability — it'd be astrology.
Days with no activity render as zero, not as gaps. A flat line reads "the agent was idle", not "the chart is broken".
When a dashboard API call fails, the UI says so and offers retry. Silent failures train users to mistrust everything else they see.
Missing cost data is shown as "unavailable", not as $0.00. If we don't know, we say we don't know.
A line chart with one point is just an invisible dot. Pinchy renders it as an actual dot, because one data point is still a data point.
If an agent was deleted last week, its past cost doesn't vanish from last month's total. The dashboard marks it as deleted and keeps the history.
Pinchy runs a usage poller that connects to the underlying OpenClaw runtime and records token consumption with source classification. Plugin usage records are resolved back to the originating session and user. Negative token reports are rejected outright — garbage that would otherwise quietly distort charts.
The result: the dashboard shows what actually happened, under the right identity, with data that makes sense.
Learn More
FAQ
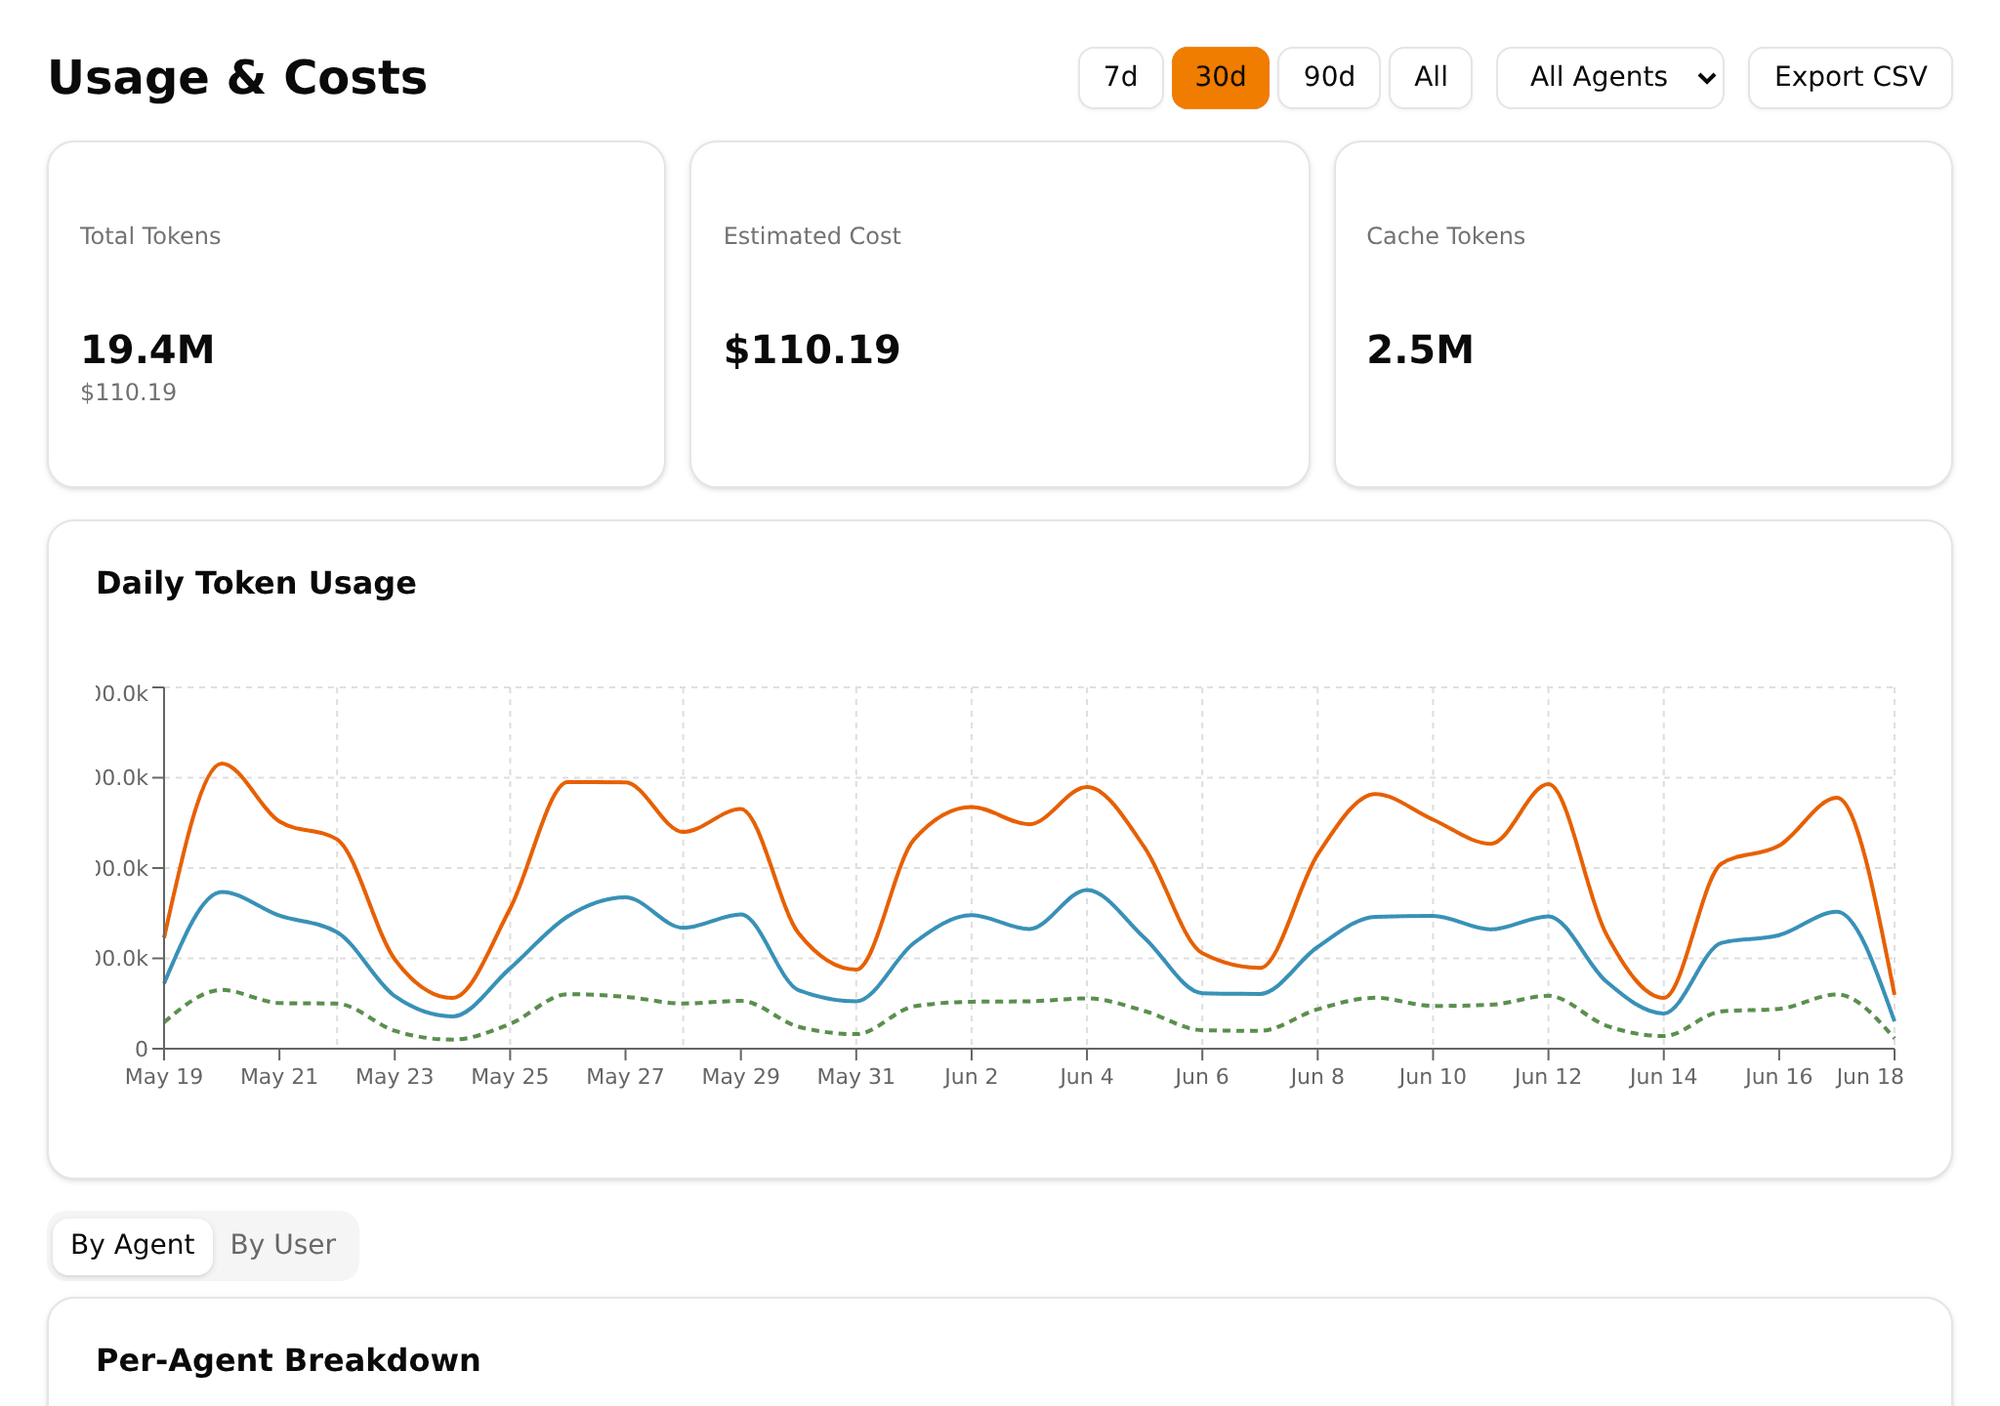
Token consumption and cost per agent, broken down by source: user chat, system activity, and plugin executions. Cache reads and writes are counted separately so cost attribution stays honest. Time series are aggregated in the user's timezone with missing days zero-filled.
Yes. Cache read and cache write tokens are tracked separately and included in cost estimation. Modern model usage depends heavily on prompt caching, and ignoring it would understate real costs — or overstate apparent savings.
Yes. Plugin token usage is classified by source, so a question like 'why did this agent cost so much yesterday?' has an answer beyond 'there were tokens'. You can see whether the cost came from user conversations, background system activity, or specific plugins (for example, document analysis via vision APIs).
Failed API calls show explicit retry states rather than silently rendering zeros. Unavailable cost data is displayed as unavailable, not as $0.00. The goal is that what you see on the dashboard matches what actually happened — which is the whole point of having one.
Self-host Pinchy yourself in minutes, or book a call to talk it through. Your choice.
Or email us: info@heypinchy.com